Average Return - It’s Not What You Think
Compound Annual Growth Rate (CAGR) is the proper way to express investment returns over a period, not (arithmetic) average
If you are used to averaging the last few months/years of an investment to determine your “average return”, you are not getting the answer you want.
Below will explain why and show you how to calculate CAGR.
Let’s start with a simple example:
A stock you own goes from $100 to $50. Your gain was ($50-$100)/$100 = -50%.
Now the stock goes from $50 to $100. Your gain was ($100-$50)/$50 = 100%.
You average arithmetic gain was 25%: (-50% + 100%)/2 = 25%.
But the stock started at $100, and ended there. There was no gain.
Claiming a gain of 25% is very misleading.
Investments Compound
The correct way to calculate investment returns is by multiplying successive gains/losses. Using the prior example, the calculations are:
$50/$100 * $100/$50 = 1.0
Each periods gain/loss is calculated as the ratio of (ending value)/(starting value). To get the net gain/loss, multiply the values from all periods.
CAGR is the calculation to determine average growth rate, which is the value most people think of when they say “average return”. CAGR answers the question “If I earn X% for Y% periods, how much did my balance change”.
CAGR Calculation Explained
- CAGR is the Compound Annual Growth Rate.
- This calculation shows the true annualized growth rate.
- It calculates the geometric mean of investment returns.
- CAGR uses the formula (End Value/Start Value)^(1/Years) - 1.
CAGR Example
You bought a stock for $100 in 2010.
You sold the stock for $280 in 2020.
CAGR = ($280/$100)^(1/(2020-2010)) - 1 = .108 = 10.8%.
Or, on average, each year the balance increased by 10.8%.
The reverse of the calculation is: ( 1 + 0.108)^10 = 2.8
I.E. the value of the investment increased by a factor of 2.8 over the 10 years.
CAGR - Generally Lower Than Arithmetic Average
Below is histogram of the output of 10,000 runs of a simulation that generates 30 year long random sequences of returns with arithmetic mean 7.0% (stdev 17%).
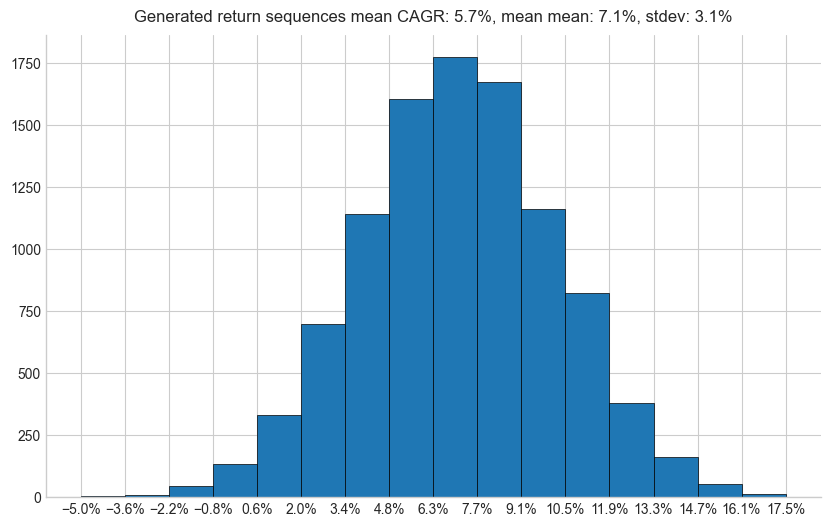
The arithmetic average of returns is 7.1%, yet the average CAGR is just 5.7%. Using the arithmetic average for this data overstates annual returns by 1.4%.
This demonstrates how arithmetic averages generally overstate returns.
Ready to learn more?
Dive deeper into investing, saving, and withdrawal strategies through our comprehensive Learning Track.
Prefer updates in your inbox? Subscribe via Substack to get all our content delivered straight to you via email.
We love hearing from our readers. If you have questions about this post, or want to suggest a topic for a future article, please use the Chat link on our Substack home page to reach out.
Thanks for reading! This post is public so feel free to share it.
Disclaimer
**For Educational Purposes Only:** All content on this site, including articles, tools, and simulations, is for informational and educational purposes only. It should not be construed as financial, investment, legal, or tax advice. The information provided is general in nature and not tailored to any individual’s specific circumstances.
**Software Development Has Inherent Risks:** The software used to perform the analyses may have errors or inaccuracies. When we post updates to any material, errors or inaccuracies that are subsequently fixed may change the results.
**No Guarantees & Risk of Loss:** The analyses and simulations presented are based on historical data. Past performance is not an indicator or guarantee of future results. All investing involves risk, including the possible loss of principal. Market conditions are subject to change, and the future may not resemble the past.
**No Fiduciary Relationship:** Your use of this information does not create a fiduciary or professional advisory relationship. We are not acting as your financial advisor.
**Consult a Professional:** You should always conduct your own research and due diligence. Before making any financial decisions, it is essential to consult with a qualified and licensed financial professional who can assess your individual situation and objectives. We disclaim any liability for actions taken or not taken based on the content of this site.
* Nobody associated with Algorithmic Fire LLC has any credential(s) or affiliation(s) with any licensing or regulatory bodies, including but not limited to: Securities and Exchange Commission (SEC), Financial Industry Regulatory Authority (FINRA).
© 2025 Algorithmic Fire LLC. All rights reserved.